FREESURFER#
FreeSurfer is a software package that enables you to analyze structural MRI images - in other words, you can use FreeSurfer to quantify the amount of grey matter and white matter in specific regions of the brain. You will also be able to calculate measurements such as the thickness, curvature, and volume of the different tissue types as features, and be able to correlate these with covariates; or, you can contrast these structural measurements between groups.
# import os
from IPython.display import Image

# from nilearn import plotting
# import nipype.pipeline.engine as pe
# import nipype.interfaces.io as nio
# from nipype.interfaces.freesurfer.preprocess import ReconAll
# from nipype.interfaces.freesurfer.utils import MakeAverageSubject

# import warnings
# warnings.filterwarnings('ignore')
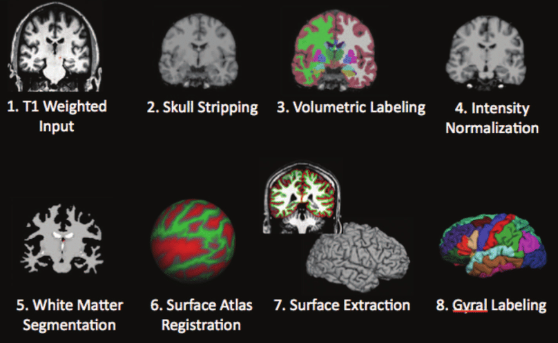
Lets have a quick look at command interface of freesurfer.
Freesurfer initialize begins with recon-all command. However, there a number of command you can work with data: convertation, group analysis, transormation.
Image(filename = "./assets/freesurfer_stream.png", width=600, height=800)
# reconall = ReconAll()
# reconall.inputs.subject_id = '100206'
# reconall.inputs.directive = 'autorecon1'
# reconall.inputs.subjects_dir = '/workspace/data'
# reconall.inputs.T1_files = '/workspace/data/raw/100206/unprocessed/3T/T1w_MPR1/100206_3T_T1w_MPR1.nii.gz'
# print(reconall.cmdline)
# reconall.run()
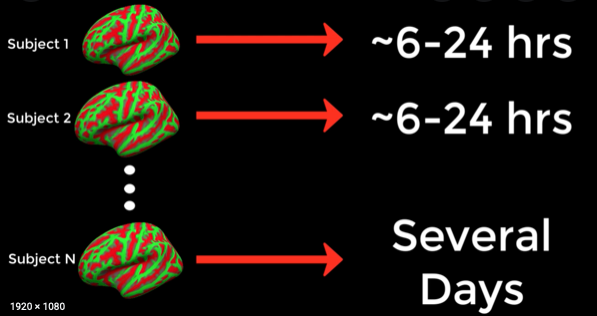
Usually it takes 6-18 hours to preprocess for 1 subject, better thick of parallelization:
Image(filename = "./assets/freesurfer_runtime.png", width=600, height=800)
# !cat /workspace/multiproc.sh
Output sctructure of freesurfer preprocessing.
# !tree ./data/freesurfer_preproc --filelimit 40
Freesurfer Output Visualization#
# import matplotlib
# cdict = {'red': ((0.0, 0.0, 0.0),
#                  (0.1, 0.5, 0.5),
#                  (0.2, 0.0, 0.0),
#                  (0.4, 0.2, 0.2),
#                  (0.6, 0.0, 0.0),
#                  (0.8, 1.0, 1.0),
#                  (1.0, 1.0, 1.0)),
#         'green':((0.0, 0.0, 0.0),
#                  (0.1, 0.0, 0.0),
#                  (0.2, 0.0, 0.0),
#                  (0.4, 1.0, 1.0),
#                  (0.6, 1.0, 1.0),
#                  (0.8, 1.0, 1.0),
#                  (1.0, 0.0, 0.0)),
#         'blue': ((0.0, 0.0, 0.0),
#                  (0.1, 0.5, 0.5),
#                  (0.2, 1.0, 1.0),
#                  (0.4, 1.0, 1.0),
#                  (0.6, 0.0, 0.0),
#                  (0.8, 0.0, 0.0),
#                  (1.0, 0.0, 0.0))}

# my_cmap = matplotlib.colors.LinearSegmentedColormap('my_colormap',cdict,256)
# my_cmap = matplotlib.colors.LinearSegmentedColormap('my_colormap',cdict,64,1.9)
For example, lets plot cortical thickness on inflated and pial surfaces.
# inflated_path = '/workspace/data/freesurfer_preproc/100206/surf/lh.inflated'
# pial_path = '' # add
# thickness_data = '/workspace/data/freesurfer_preproc/100206/surf/lh.thickness'
# plot_pial_lh = plotting.view_surf(inflated_path, thickness_data, threshold=0, cmap=my_cmap, black_bg=True)
# plot_pial_lh # try pial
Plot cortical and subcortical segmentation maps
# plotting.plot_img('/workspace/data/freesurfer_preproc/100206/mri/aparc+aseg.mgz', bg_img='/workspace/data/freesurfer_preproc/100206/mri/brain.mgz',cmap=my_cmap,threshold=0.3)
The FreeSurfer utilities mris_ca_train and mris_ca_label together implement a technique for automatically assigning a neuroanatomical label to each location on a cortical surface model based on probabilistic information estimated from a manually labeled training set (made using FreeSurfer). This procedure incorporates both geometric information derived from the cortical model, and neuroanatomical convention, as found in the training set. The result is a complete labeling of cortical sulci and gyri.
# import numpy as np
# import nibabel

# labels, ctab, shape = nibabel.freesurfer.io.read_annot('/workspace/data/freesurfer_preproc/100206/label/lh.aparc.annot')
# plotting.plot_surf_roi(pial_path, roi_map=labels,
#                        hemi='left', view='lateral',
#                        bg_on_data=True,
#                        darkness=.5)
Extract features from stats data:#
After recon-all finishes, there will be a file called subject/stats/aseg.stats. This is a table of volume and intensity statistics for each segmentation. It also contains the following metrics: https://surfer.nmr.mgh.harvard.edu/fswiki/MorphometryStats
# !cat /workspace/data/freesurfer_preproc/100206/stats/aseg.stats
# import pandas as pd
# seg_data_path = '/workspace/data/freesurfer_preproc/100206/stats/aseg.stats'

# ColHeader = next(filter(lambda line: line.startswith('# ColHeaders'), open(seg_data_path).readlines()))
# names = ColHeader.split()[2:]
# data = pd.read_csv(seg_data_path, names=names, comment='#', delim_whitespace=True, dtype=str)
# data